
The human-guided layer between your business and your technology
Most tools hand you software and wish you luck. GYSTiq puts people between you and the technology, translating your goals into tailored systems, automations, and a single dashboard, all engineered around your organization rather than built for everyone.

Purpose-built Software
When no off-the-shelf system fits the way you actually work, we deploy a tailored solution that does, built to scale effortlessly alongside your day-to-day operations.
How it works:
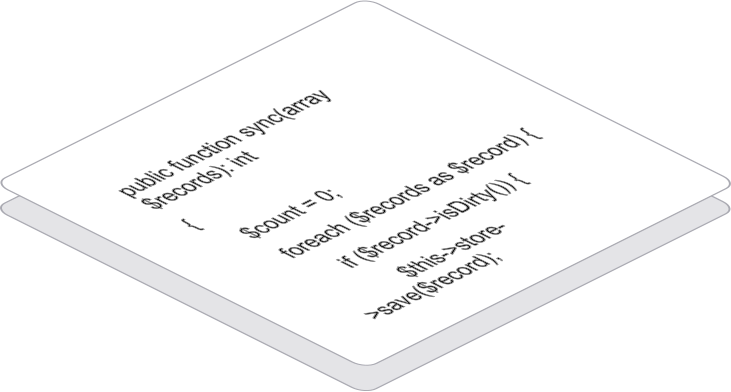
It starts with the map. The current-state picture from the Diagnose phase shows precisely where off-the-shelf tools fall short and where a tailored capability earns its place. We build only what the gap requires, a precise capability rather than a platform meant to replace everything you run. It connects into the tools you already use instead of forcing a rip-and-replace, and it ships as part of the operating layer we continue to run and refine with you.
What you get:
A capability built around your operation rather than adapted from a product made for everyone. A specific manual workaround retired, with the work it took folded into the system. Software that fits alongside your existing tools instead of replacing them. And a partner who stays to run and evolve it as your operation changes.
Connected Workflows
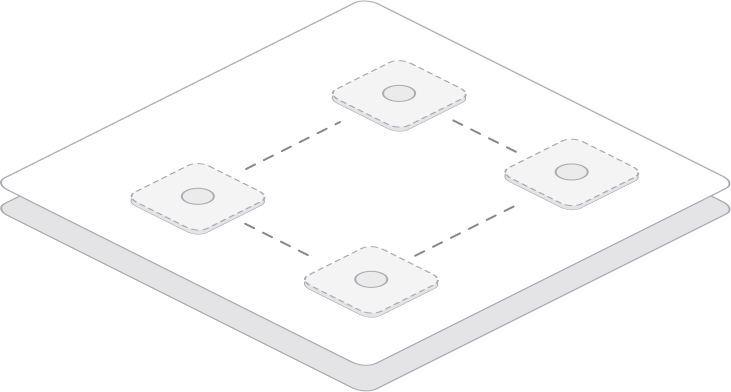
We connect your existing tools so they act in concert. Data updates flow automatically across legacy systems, eliminating manual data entry and ensuring seamless handoffs exactly where your workflows used to cross.
How it works:
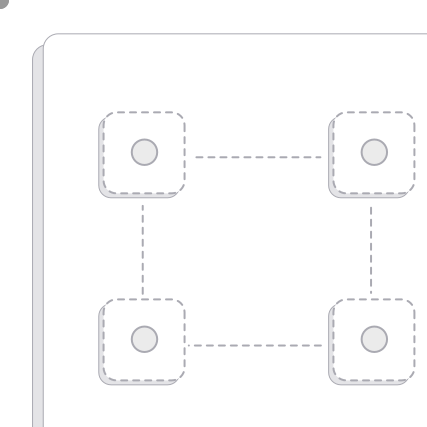
Once the map from the Diagnose phase shows where work crosses between systems, we wire those crossings so they run on their own. An update in one tool propagates to the others, and each step triggers the next instead of waiting on someone to carry it over. We start with the handoffs that cost the most time or break the most often, and we build outward from there, without replacing the tools your team already knows.
What you get:
Tools that move in step instead of in isolation. Updates that travel once and land everywhere, so the same data stops getting entered twice. The manual handoffs between systems running on their own. And a set of connected flows that hold their shape as volume grows.
Intelligence Command Center
One clear view of everything happening across your operation, built so your team can use it without a data analyst. Know what's happening, why it's happening, and what to do next.
How it works:
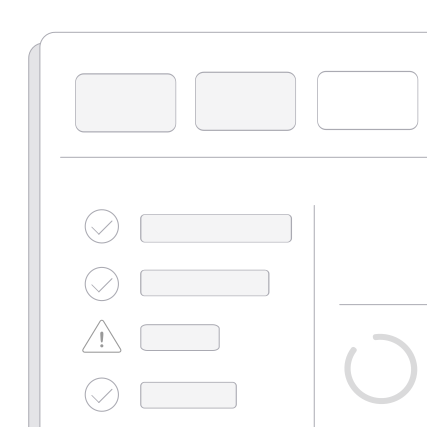
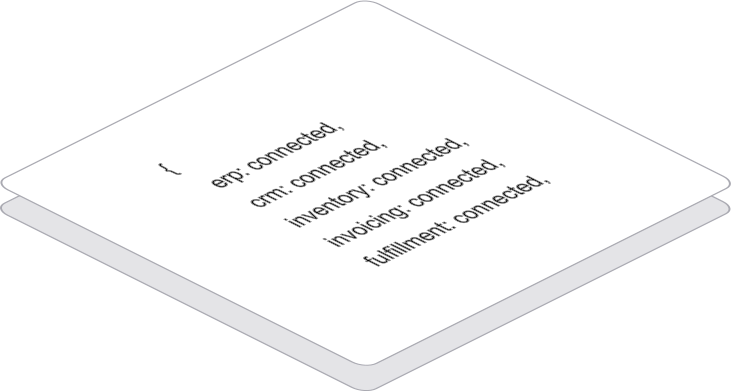
The Command Center sits on top of the systems connected during the Build phase and draws from them directly, so nothing is keyed in or stitched together by hand. It surfaces the measures that actually run your operation, shows how they're moving, and flags what needs attention, in plain language rather than a wall of charts. Because it reads from the connected flows underneath it, the view stays current on its own, and it's built around the questions you actually ask rather than a generic dashboard template.
What you get:
A single, current view across the whole operation, readable without a specialist. The end of manual reporting, with the numbers drawn live from the systems they come from. Early sight of what needs attention, while there's still time to act. And a view shaped around the decisions you actually make, not a stock template.